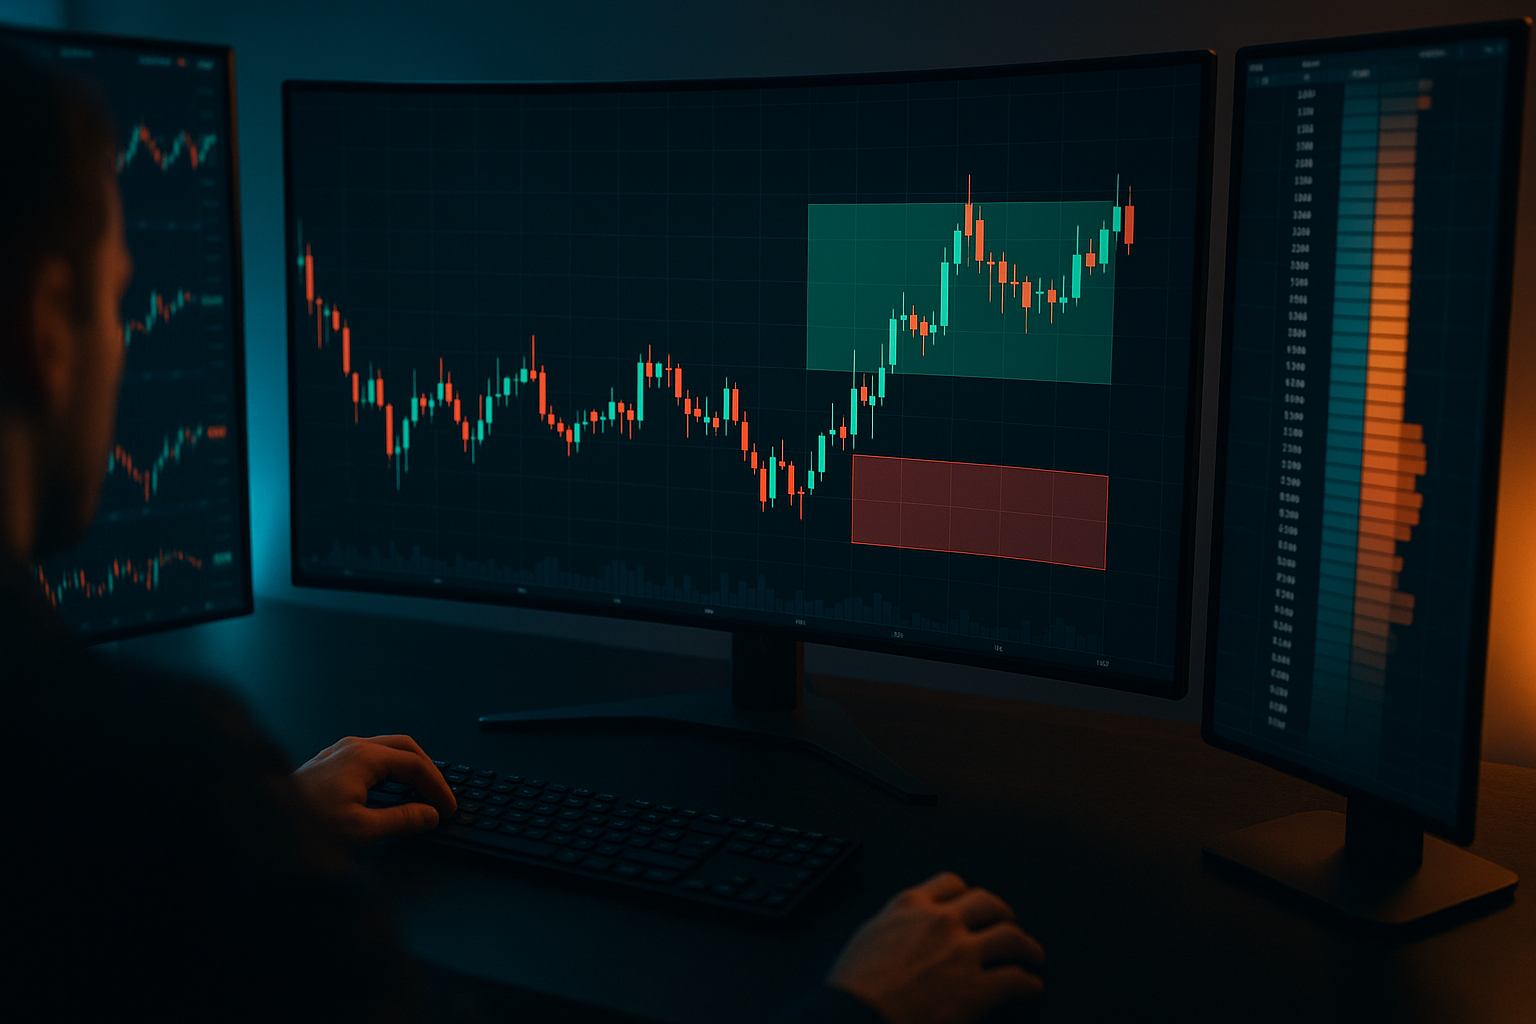
Opening Range Breakout Strategy for Futures Traders

Understanding opening range breakout strategy is essential for traders seeking consistent results. Trading the global financial markets requires a reliable, systematic methodology that capitalizes on periods of high volatility and liquidity. For futures traders, the daily market open represents the most dynamic window of opportunity, as order flow floods the exchange and sets the tone for the trading session.
One of the most popular and time-tested methods for capturing these initial moves is the opening range breakout, which allows market participants to exploit early price trends. If you want to develop your skills and trade with professional backing, partnering with this proprietary futures trading firm can provide the capital and tools necessary to elevate your career.
What Is an Opening Range Breakout Strategy?
To successfully navigate the complex world of futures contracts, traders must learn to distinguish between random noise and sustainable price direction. Utilizing scalable funded accounts can help traders manage their risk while scaling up their position sizes as they master this classic trading setup.
This specific methodology, widely referred to as the opening range breakout, is designed to capture rapid, directional moves that occur immediately after the official market opening bell rings. By identifying clear boundary lines established during the initial minutes of trading, operators can place high-probability trades with defined risk parameters. Let us examine the specific mechanics that underpin this approach.
How the Opening Range Is Defined
The opening range is established by identifying the high price and low price of a security during the very first segment of the trading session. This timeframe can range from a brief one-minute window to a broader sixty-minute period, depending on the specific asset class and the personal style of the trader. In major futures markets, such as equity index futures or crude oil, the initial fifteen minutes after the open typically represent the most significant period for defining these critical boundaries.
Why Breakouts Occur After the Market Opens
When the official cash market opens, a massive influx of institutional buy and sell orders is executed simultaneously on the exchange. This sudden burst of volume is driven by overnight news releases, macroeconomic data reports, and institutional portfolio adjustments that have accumulated since the previous session closed. As these orders interact, the market undergoes a rapid price discovery process that quickly overwhelms local liquidity and establishes a dominant directional momentum.
How the Opening Range Breakout Strategy Works
Implementing the opening range breakout requires a structured execution plan that removes emotional decision-making from the equation. Utilizing a clear trading approach ensures that you do not chase bad fills or enter trades prematurely during high-volatility environments. By combining precise technical rules with robust risk management, traders can systematically isolate high-probability opportunities during the first hour of the session. Success with this strategy depends on consistency, attention to detail, and a deep understanding of several critical operational steps.
Choosing a 5, 15, or 30-Minute Opening Range
Selecting the appropriate timeframe for measuring the opening range is a critical decision that dictates a trader's risk exposure and trade frequency. A shorter five-minute window offers very fast entry signals and smaller initial stop-losses, but it also exposes the trader to a much higher frequency of false breakouts and market noise.
Identifying Breakout Entry Signals
A valid entry signal occurs when the price action decisively penetrates either the high or the low boundary of the pre-defined opening range. Aggressive traders will often enter a position the exact moment the price ticks beyond the boundary, hoping to capture the maximum possible move.

Setting Stop-Loss and Profit Targets
Every trade executed with this strategy must have a clearly defined exit plan before the position is opened. The standard stop-loss placement for a bullish breakout is typically set just below the midpoint of the opening range or at the opposite boundary for tighter setups. For a bearish breakout, the protective stop-loss is placed just above the midpoint or high of the initial range to limit exposure if the market reverses.
Opening Range Breakout Strategy Example
To fully understand how this approach operates under real-world conditions, let us analyze some practical scenarios involving index futures. Adhering to structured risk parameters is critical during these highly volatile sessions, as quick price spikes can easily catch unprepared traders off guard. Major index futures, such as those listed on the CME Group exchange, provide the perfect canvas for observing these patterns due to their deep liquidity and constant institutional participation. The following examples demonstrate how these concepts manifest on a daily chart.
Bullish Opening Range Breakout
Imagine trading the E-mini S&P 500 futures contract on a morning when positive economic data is released just before the opening bell. During the first fifteen minutes of the trading session, the market establishes an opening range with a high boundary at 5100 and a low boundary at 5080. At exactly 9:46 AM, a surge of buying volume pushes the price upward, and a fifteen-minute candle closes decisively at 5105.
Bearish Opening Range Breakout
Consider another scenario where geopolitical tensions rise overnight, causing a weak open in the Nasdaq 100 futures market. The index establishes its initial fifteen-minute opening range with an upper resistance level at 18000 and a lower support level at 17920. Shortly after the range is established, heavy institutional selling pressure forces the price to slice downward through the support level.
How to Avoid False Opening Range Breakouts
One of the primary challenges when trading this system is dealing with fakeouts, where the price briefly crosses a boundary but immediately reverses course. Relying on preferred trading platforms that offer real-time order flow data can help you analyze the depth of the market and spot these traps before they damage your account balance.
Confirming Momentum and Trading Volume
High transactional volume is the primary fuel that sustains any genuine breakout in the highly competitive futures market. When price breaks out of the opening range on light volume, it typically indicates that large institutional players are not participating in the move.
Waiting for a Candle Close or Retest
Many false breakouts occur when the price briefly spikes beyond the opening range high or low but quickly retracts before the candle completes. By waiting for the actual breakout candle to close outside of the range, you gain valuable confirmation that the market has accepted the new price levels. An even more conservative approach involves waiting for the price to break out and then pull back to retest the broken boundary as new support or resistance.
Managing Risk When Trading Opening Range Breakouts
No trading system is complete without a comprehensive risk management protocol designed to protect your capital from sudden market turnarounds. Because the early market session is characterized by elevated volatility, price swings can be incredibly swift and severe. According to educational resources on Investopedia, implementing strict capital preservation rules is the single most important factor in long-term trading survival. To protect your hard-earned capital, you must establish clear rules regarding how much capital is put at risk on any individual trade. Let us break down the primary risk mitigation tactics you should use.
Determining Optimal Position Sizes
Determining your position size should always be done systematically based on the distance to your stop-loss rather than emotional impulse. Since opening range volatility can vary greatly from day to day, your position size should shrink on highly volatile days and expand on quieter days.
Utilizing Daily Loss Limits
Establishing a strict daily loss limit is a critical tool for preventing emotional trading decisions and saving yourself from a catastrophic trading day. If you experience two or three consecutive breakout failures in the morning, it is highly likely that the market is stuck in a choppy range.

Common Opening Range Breakout Trading Mistakes
Even highly experienced futures traders can fall victim to common pitfalls when executing early-morning breakout strategies. The rapid pace of the opening bell often induces a state of heightened emotion, making it incredibly easy to abandon disciplined execution. Recognizing these behavioral traps beforehand can help you remain objective and avoid costly, unforced errors during the heat of the trading session. Below are the most frequent mistakes that can undermine an otherwise successful breakout plan.
Chasing the Market After a Huge Gap
One of the most frequent mistakes traders make is chasing a breakout that has already moved far beyond the initial entry point. When you enter a position too late, your stop-loss must be placed incredibly far away, which completely ruins your risk to reward ratio.
Trading Prior to Major Economic Releases
Attempting to trade opening range breakouts right before high-impact economic reports are released is a highly dangerous practice. News events such as inflation reports, employment data, or interest rate decisions can cause immediate, unpredictable price spikes that ignore all technical levels.
Is the Opening Range Breakout Strategy Effective for Funded Traders?
For proprietary traders working with funded accounts, consistency and strict risk compliance are the absolute cornerstones of long-term success. Many evaluation programs require traders to hit profit targets while adhering to tight daily drawdowns and overall risk limits.
Aligning with Daily Drawdown Limits
Funded evaluation programs place a massive emphasis on protecting capital, meaning that a single oversized loss can end your tryout immediately. Because the opening range strategy relies on clearly defined, pre-planned stop-losses, it aligns perfectly with these rigid risk mandates.
Generating Consistent Profits Through Structure
Prop firms look for traders who can generate steady, repeatable profits rather than hit erratic, lucky home runs. The structured nature of opening range breakouts provides a highly repeatable framework that can be executed day after day across various markets.
FAQs About the Opening Range Breakout Strategy
To help you further refine your understanding of this powerful trading methodology, we have compiled answers to some of the most frequently asked questions. These answers address key aspects of timeframes, market selection, and risk management techniques.
What is the best timeframe for an opening range breakout?
While there is no single best timeframe for every individual trader, the fifteen-minute chart is widely considered the industry benchmark for executing an opening range breakout. This fifteen-minute range successfully filters out the hyper-volatile noise of the first few minutes while still preserving the majority of the day's trend.
Does the opening range breakout strategy work for futures?
Yes, the opening range breakout is highly effective when applied to the futures market due to the exceptional liquidity and volume found there. Equity index futures, currency futures, and commodity contracts all display strong, clean trends immediately following the market open. Because futures markets trade nearly twenty-four hours a day, the transition to the primary pit session triggers a reliable surge in institutional activity.
Which futures contracts are best for opening range breakouts?
The most suitable futures contracts for this specific strategy are those that exhibit high average daily trading volume and consistent volatility. Stock index futures such as the E-mini S&P 500, Nasdaq 100, and Dow Jones futures are prime candidates due to their immense institutional participation. Commodity futures like crude oil and gold are also excellent choices because they tend to trend aggressively on global supply and demand news.
How can traders identify a false opening range breakout?
Identifying a false breakout requires a close observation of the relationship between price action and transactional volume. A genuine breakout will almost always be accompanied by a massive expansion in volume as institutions aggressively push the price out of the range. If the price moves past the high or low boundary on below-average volume, it is highly likely a trap designed to capture retail liquidity.
 Kim Tyson